10.3 Paired tests for cohorts
In intervention studies, it is often necessary to analyze paired omics data from the same subjects before and after treatment (e.g., comparing gut microbiome profiles of ulcerative colitis patients pre- and post-probiotic intervention) and perform matched-pairs statistical tests. To ensure proper execution of paired analyses, phenotypic data must include sample-subject matching information.
🏷️Example:
Step1: Process sample-related data
To meet the requirements for paired statistical analysis, the primary column must include corresponding subject-matching identifiers.

Step2: Process paired test
Note:
The differential analysis module currently supports paired tests for two-group comparisons only. For multi-group paired analyses, users can directly perform the tests within the visualization module.
The differential analysis module currently supports paired tests for two-group comparisons only. For multi-group paired analyses, users can directly perform the tests within the visualization module.
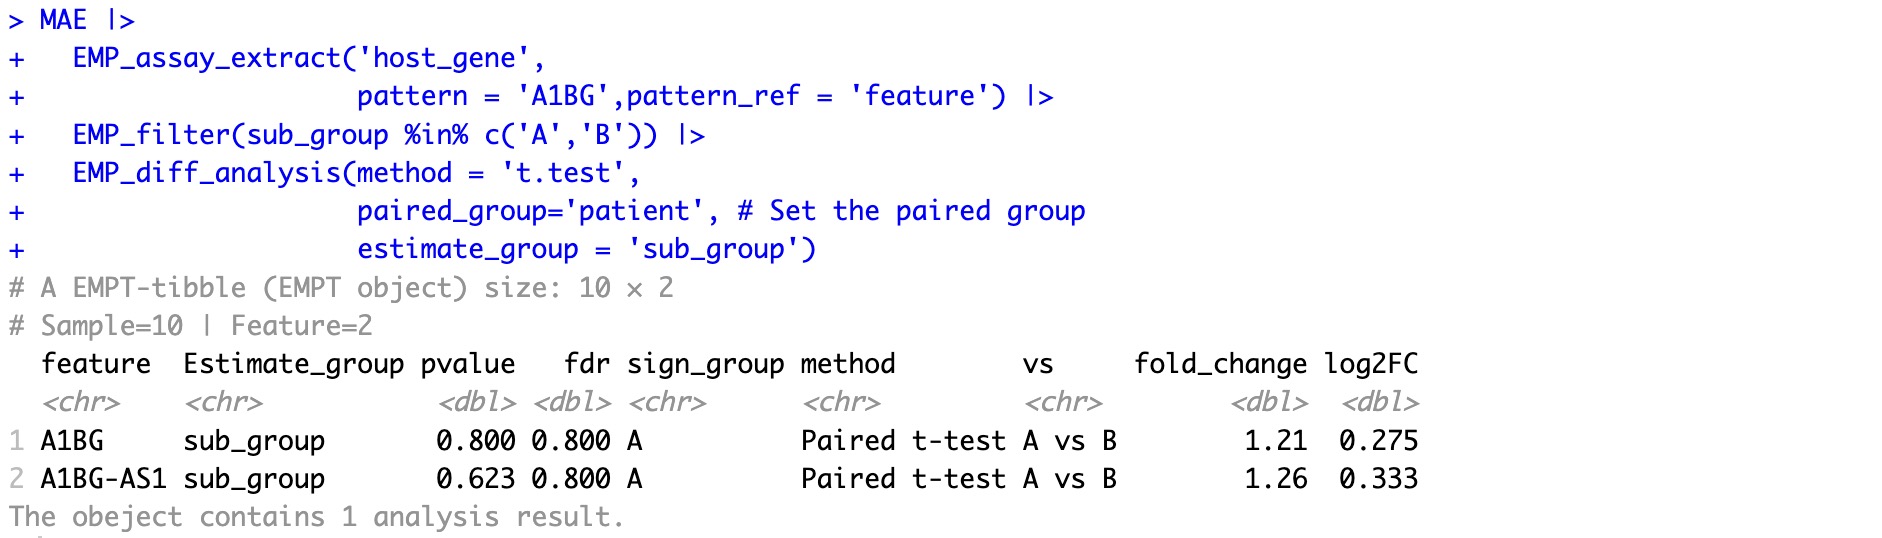
MAE |>
  EMP_assay_extract('host_gene',
                    pattern = 'A1BG',pattern_ref = 'feature') |>
  EMP_filter(sub_group %in% c('A','B')) |>
  EMP_diff_analysis(method = 't.test',
                    paired_group='patient', # Set the paired group
                    estimate_group = 'sub_group')
Step3: Visualization of paired-test results
Note:
The
The
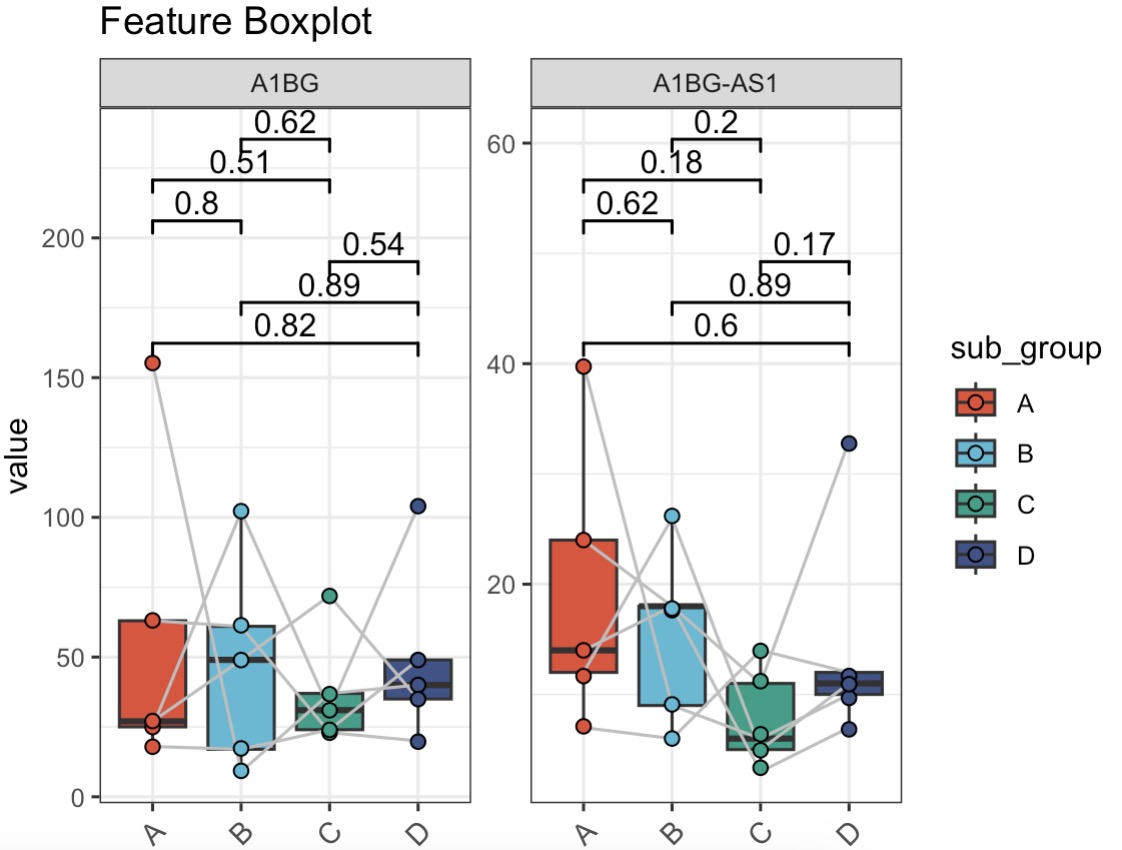
paired_line parameter controls the display of connecting lines between paired data points.MAE |>
EMP_assay_extract('host_gene',
pattern = 'A1BG',pattern_ref = 'feature') |>
EMP_boxplot(method='t.test',
estimate_group='sub_group',
paired_group='patient') # Set the paired_group
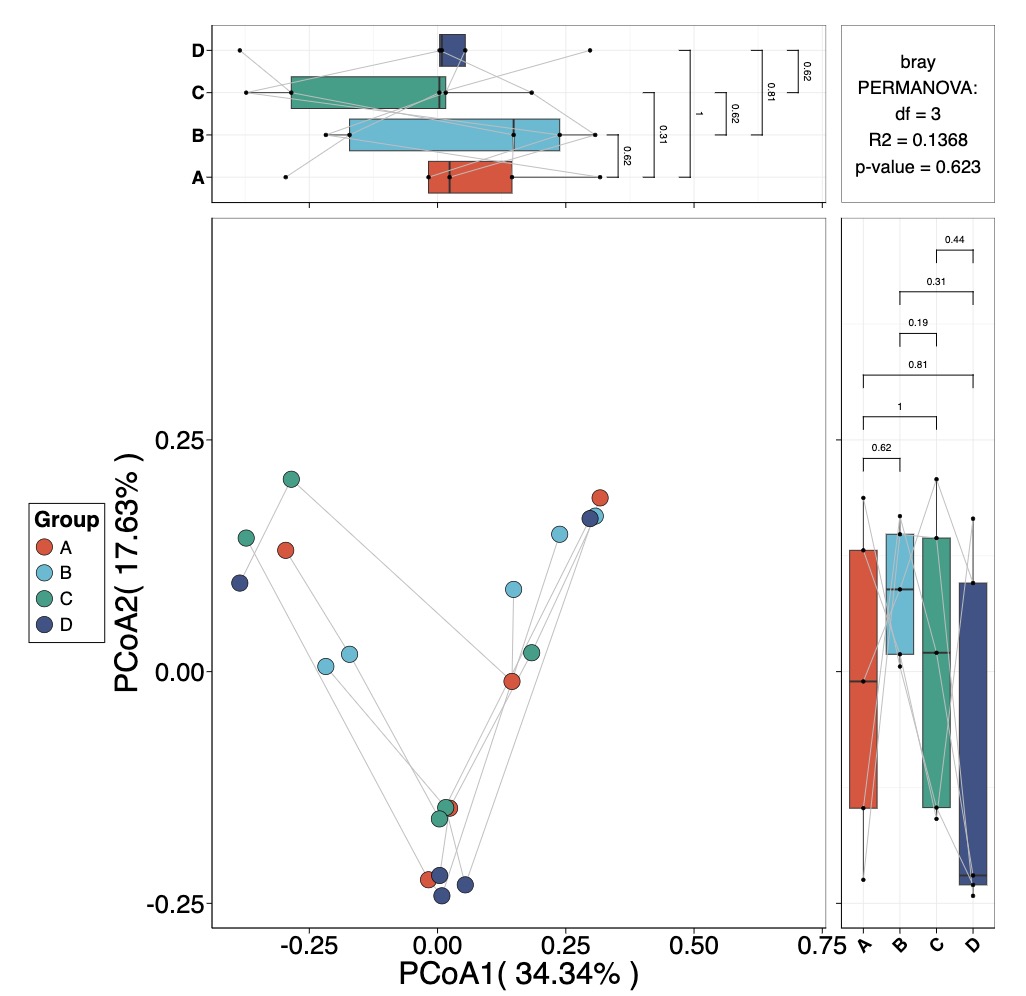
MAE |>
  EMP_assay_extract('taxonomy') |>
  EMP_collapse(estimate_group = 'Species',collapse_by = 'row') |>
  EMP_dimension_analysis(method = 'pcoa',distance = 'bray')|>
  EMP_scatterplot(show='p12html',
                  paired_group='patient',
                  estimate_group = 'sub_group')